Executive Summary
Goal
The goal of this exercise is to apply your data analytics skills to create a comprehensive Power BI report and dashboard for Adventure Works. The focus is on transforming raw sales and customer data into actionable insights that can assist high-level executives in making informed, strategic decisions.
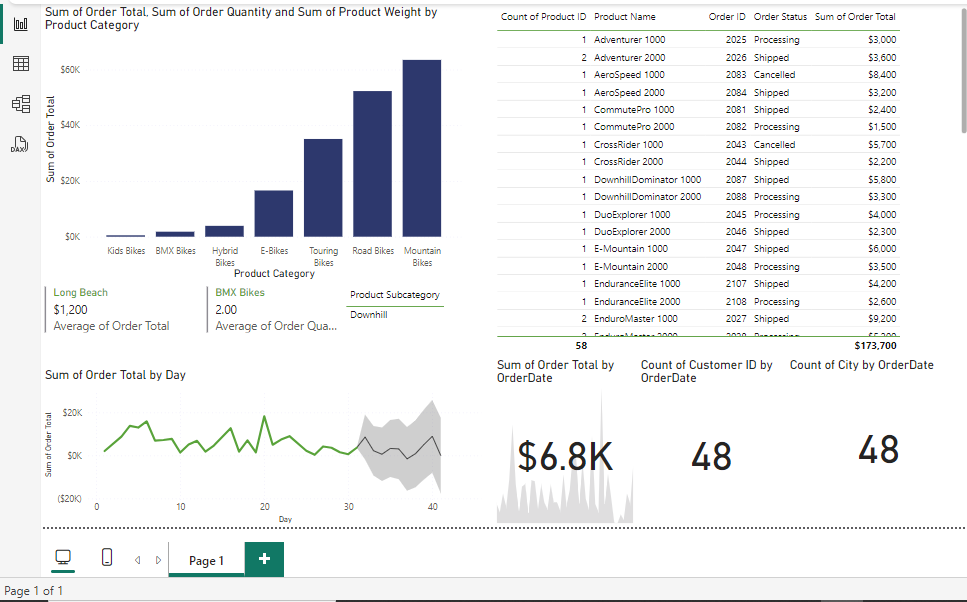
Core Visualizations:
Create a table to track sales and order statuses. Develop a column chart to highlight revenue-generating products. Design a line chart to visualize sales trends over time.
KPIs:
Generate KPIs to measure sales goals, customer reach, and global expansion efforts.
Forecasting:
Use Power BI's forecasting features to anticipate future sales trends and identify key seasonal patterns.
Q&A Configuration:
Set up the Q&A visual to allow executives to ask natural language questions and receive data-driven answers instantly.
Result
By the end of this exercise, you will have created a powerful tool that not only visualizes data but also provides a narrative that the executives can use to make informed, strategic decisions. This exercise emphasizes the importance of translating data into actionable insights, proving that data is not just an asset, but the essence of strategic decision-making.